Following some server monitoring advice from the excellent ‘Building Scalable Web Sites’ by Cal Henderson, I’ve recently been experimenting with Ganglia on a cluster of servers at Tangent Labs. It has proved to be deeply impressive and has given us a great tool for keeping an eye on how our servers are performing, as well as providing an invaluable diagnostic tool should things go wrong.
In essence, Ganglia is a distributed monitoring application that allows statistics on a cluster of servers to be aggregated in a single place. Moreover, an excellent web front-end is also provided to view charts of the statistics being collected. You can view a live demo of the Ganglia monitoring application for the UC Berkeley Millennium Project which shows exactly what Ganglia can provide.
Out of the box, Ganglia collects basic server stats on load, memory, CPU, network and disk. However, what makes it great is that it can be easily extended to collect statistics on anything that you can measure from the command line. There is a repository of user-contributed scripts although it’s not that extensive. In this post, I detail a script that can used to feed statistics about MySQL into Ganglia for monitoring - something important to any LAMP-stack application.
A few technical details first: Ganglia utilises three utilities to run each with a distinct responsibility:
- gmond
-
A daemon responsible for collecting monitoring stats and sharing them using XML over TCP. The gmond daemon runs on all nodes that you want to monitor.
- gmetad
-
A daemon responsible for collecting and storing data from other gmetad and gmomd services. This only needs to be running on a single, central node.
- gmetric
-
A command-line application used for using Ganglia to monitor custom metrics.
All very simple really - see the docs for the nitty gritty. Ok, enough intro -here’s my script for MySQL:
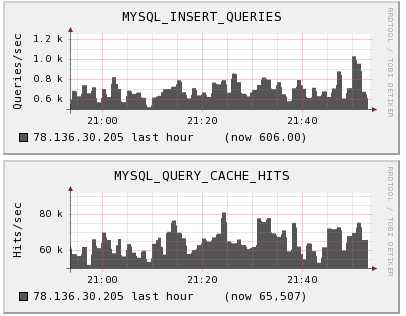
It’s written in Bash and uses a temporary file to read the MySQL stats into before parsing and submitting to gmetric. This is done as many of the MySQL stats of interest are cumulative counts rather than rates (eg SELECTs per second) which are generally of more interest. Hence, the script estimates the rate of change by dividing the value delta by the timestamp delta.
To use this script, simply copy it into a convenient location, ensure it is executable and add the following line to your crontab.
* * * * * /path/to/gmetric-mysql.sh > /dev/null 2>&1
As soon as this is done, your Ganglia web front-end should start plotting the new metrics.